What an ICT daily bias scanner does
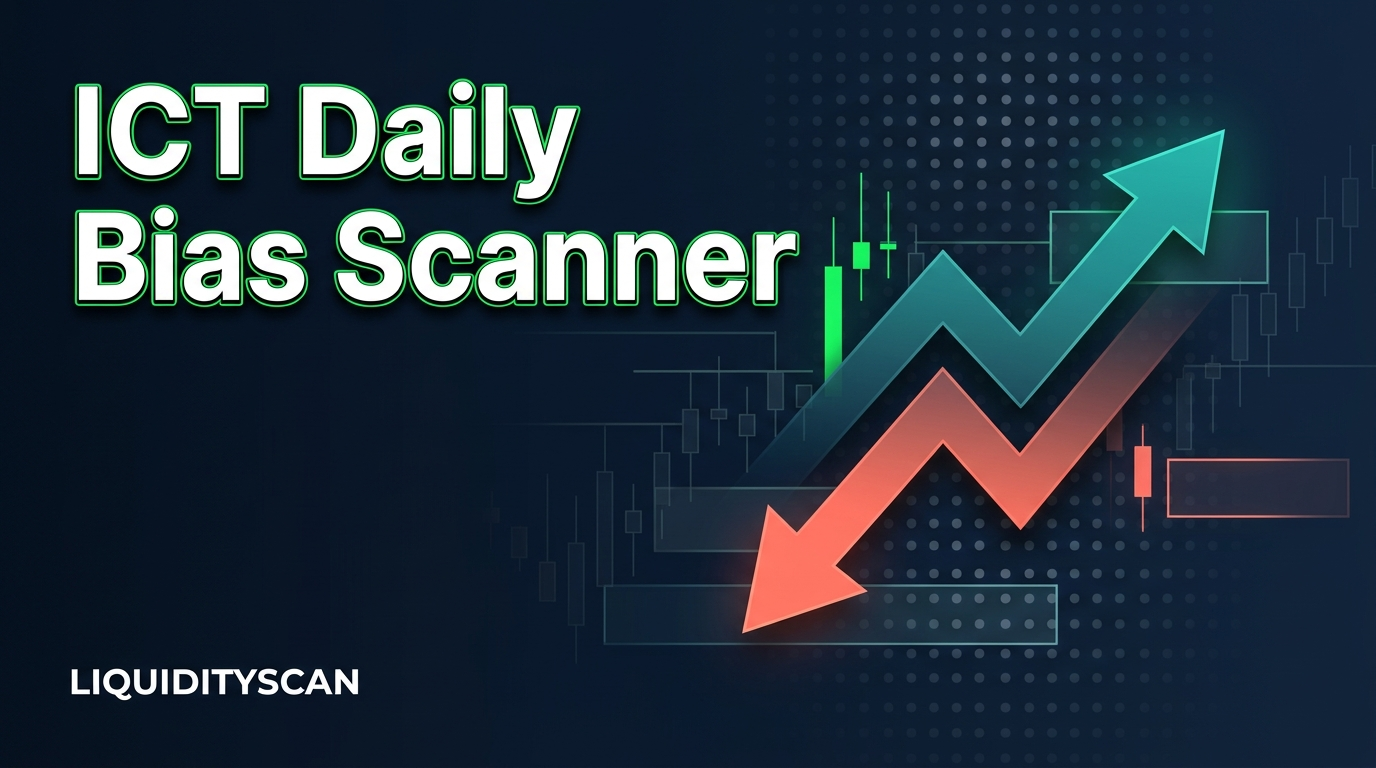
An ICT daily bias scanner reads the last closed daily candle on every market it covers and labels each one bullish or bearish, so you start the session knowing which side to look on instead of building that view one chart at a time. On LiquidityScan the label comes from one rule: a candle that closes above the previous candle's high sets the bias for the next candle up, and a candle that closes below the previous candle's low sets it down.
That is all the scanner claims. It does not forecast the day's high or low, and it is not a buy or sell call. This article is about the tool: the rule, what you see on the page, how to use it before a session and where the label stops helping. For the concept itself, meaning how to form a daily and weekly directional view in the first place, our guide to determining daily and weekly bias is the main reference. Read the two together.
The rule behind each label
The scanner compares two candles: the one that just closed and the one before it. Only the close counts.
- Bullish Confirmation. The candle closed above the previous candle's high, so the bias for the next candle is up.
- Bearish Reversal. The candle closed below the previous candle's low, so the bias for the next candle is down.
Picture two daily candles. Monday's range runs from 95 to 100. Tuesday trades up to 102 and closes at 101. The close sits above Monday's high, so Tuesday prints a bullish label and Wednesday starts with an upward lean. Now change one detail: Tuesday still reaches 102 but closes at 99. Price went through Monday's high and could not hold above it, so the close is back inside Monday's range and there is no bullish label. That second candle looks more like a liquidity sweep, a wick beyond a level that takes the stops resting there before price turns back, and it reads the opposite way.
This is why the rule uses the close and ignores the wick. A wick above a prior high shows that price visited. A close above it shows buyers still had control when the candle ended. A candle that closes inside the previous candle's range meets neither condition.
What does up mean in practice? Traders usually treat it as a working assumption that the next candle trades higher, with the signal candle's high as the first level to watch. The same rule in reverse cancels the idea: if a later candle closes below the low of the candle before it, a Bearish Reversal prints and the lean flips.
How to find daily bias on LiquidityScan
Bias is one of the eight classic scanners, which are free to read with no time limit. Pages inside the app need a free account.
- Sign up. Create a free account. No card is needed.
- Open the scanner. Go to the Bias scanner. It shows 1H markers and a live bias on 4H, 1D and 1W.
- Pick the market mode. The same scanner runs on crypto perpetuals, on forex (72 instruments, including the seven majors and metals such as XAU/USD) and on TradFi (stocks, indices and commodities). Exotic forex pairs sit on a separate tab because their spreads are wide and their prices gappy.
- Read the daily signals. A 1D signal means that market's daily candle closed beyond the prior candle's high or low. The label tells you which side.
- Check the timeframes around it. Look at the same market on 1W and 4H. A bullish daily label under a bearish weekly one is a different situation from two that agree.
- Star what you want to follow. Starring a market on the scanner page adds it to your Watchlist, where its signals from every scanner sit in one place. The Free plan holds one watchlist of five markets.
The page uses four tags:
| Tag | What happened | How to read it |
|---|---|---|
| Bullish Confirmation | The candle closed above the previous candle's high | Bias for the next candle is up. Context for long-side setups |
| Bearish Reversal | The candle closed below the previous candle's low | Bias for the next candle is down. Context for short-side setups |
| MARKER | A 1H bias drawn on the chart only. It is not checked against the next candle and clears after 4 candles | An intraday heads-up, not a daily bias |
| KZ | The signal candle opened inside the 12:00–16:00 UTC kill zone, a window of concentrated trading activity | Applies to 1H and 4H only, so it does not appear on daily signals |
Using the bias before your session
Detection runs on closed candles only, so a daily label is fixed from one daily close to the next. It will not flicker while you trade. That makes it a pre-session input, and a short routine gets the most from it:
- Start on 1W. Note which of your markets carry a weekly bias and in which direction.
- Move to 1D. Keep the markets where the daily label agrees with the weekly one.
- On each shortlisted chart, mark the signal candle's high and low. In a bullish case the high is the first level to watch, and a later close below the low would flip the label.
- Drop to 4H or 1H and wait for your own entry model in the direction of the bias. The bias chooses the side. It does not choose the entry.
This is the first half of standard top-down analysis, and it fits inside a 15-minute pre-session scan. With 600+ pairs covered, the scanner does the part that is not realistic by hand: checking the same rule on every market.
One thing a daily label does not describe is the path. In the Power of Three model (accumulation, a manipulation move against the day's direction, then distribution), a bullish day can trade below its open first. A bullish bias and an early dip are compatible, which is why the label is not an instruction to act at the open. The mechanics are in how to trade the Power of Three on the daily candle.
Stacking the bias with other layers
Bias signals also feed other parts of the platform. Each one belongs to a plan.
- Core Layer. When Bias points the same way on two or more timeframes of one market, Core Layer shows it as a chain anchored on Weekly, Daily or 4H. Base shows chains up to depth 3 and Pro up to depth 5. It is not part of Free or Starter. The walkthrough is in finding setups that agree on 4H, daily and weekly.
- Pulse. A filter that passes a Bias signal only when RSI on the same timeframe also confirms it: oversold for longs, overbought for shorts. The Pulse feed starts on Starter. Details are in RSI confirmation for ICT signals.
- Confluence. Ready-made recipes use bias as the higher-timeframe condition, for example a daily bias with a 4H CRT in the same direction. CRT, Candle Range Theory, is a sweep of a candle's high or low followed by a close back inside its range. Dual and triple recipes open on Base.
- Alerts. Reading the scanner is free. Alerts on the eight classic scanners start on Starter and are set up in My Alerts. They arrive by browser push, Android push or the in-app bell. There is no Telegram delivery. To keep them quiet, see how to choose the pattern, markets and timeframe for alerts.
- Waiting Room. Name a market, the Bias scanner and a timeframe. It shows whether the setup fired on the last close or is armed, meaning it would fire if the current candle closed now. The number of waits depends on the plan.
Where a bias label misleads
The rule is two candles wide. Everything it gets wrong follows from that.
- Ranges. In a sideways market, a close above the prior day's high can land at the top of the range, where the move is running out of room. The label says up while the structure says nowhere. Check whether the market is trending or consolidating before leaning on it.
- Closes into a higher-timeframe level. A bullish close that ends just under a weekly high, or inside a bearish weekly order block (the last up candle before a strong move down), has little clear space above it. The daily rule does not know the level is there.
- One-off candles. A single news-driven day can close beyond the prior range and be followed by nothing. The rule cannot tell an impulse that starts a leg from one that ends it.
- Conflicting timeframes. Daily up against weekly down may be nothing more than a pullback inside the weekly move. The scanner shows both labels. Deciding which one governs is your job.
- Gappy markets. On exotic forex pairs a gap can carry a close beyond the prior candle with little trading behind it.
- No entry, stop or target. Bias is direction. Where to get in, where your trade idea is wrong and where to exit come from your own model.
LiquidityScan is software and education, not a signal service. A bias label is context for your own decision, and this article puts no number on how often the next candle follows it.
Frequently Asked Questions
What rule does the ICT daily bias scanner use?
It compares the last closed candle with the one before it. A close above the previous candle's high is labelled Bullish Confirmation and sets the bias for the next candle up. A close below the previous candle's low is labelled Bearish Reversal and sets it down. Wicks do not count.
Is the Bias scanner on LiquidityScan free?
Reading it is. Bias belongs to the eight classic scanners, which stay free with no card and no time limit. Alerts on the classic scanners and the Pulse filter start on the Starter plan. Core Layer and the dual and triple Confluence recipes start on Base.
Does the daily bias change during the trading day?
No. Detection runs on closed candles, so a daily label holds until the next daily candle closes. To see what the candle in progress would produce, the Waiting Room shows whether a setup is armed, meaning it would fire if that candle closed now.
Does the Bias scanner cover forex and indices or only crypto?
All three market modes. Every scanner runs on crypto perpetuals, on 72 forex instruments including the majors and metals, and on TradFi markets such as the S&P 500, Nasdaq 100 and index CFDs like US30 and GER40.
Is a bullish daily bias a signal to buy?
No. It says the last daily candle closed above the prior candle's high and nothing more. It carries no entry, stop or target, it can print at the top of a range, and a bullish day can still trade lower first. Treat it as a filter for which side to look on.
Related reading
- Daily/Weekly Bias Determination & Trade Journaling — the concept behind the label: how to form a daily and weekly bias and record it.
- Multi-Timeframe Scanner: Find Setups That Agree on 4H, Daily and Weekly — what changes when bias lines up on several timeframes at once.
- Candle Close Confirmation: How to See ICT Setups One Close Before They Trigger — how to follow a bias that has not printed yet without acting on an open candle.