What the ICT entry sequence is
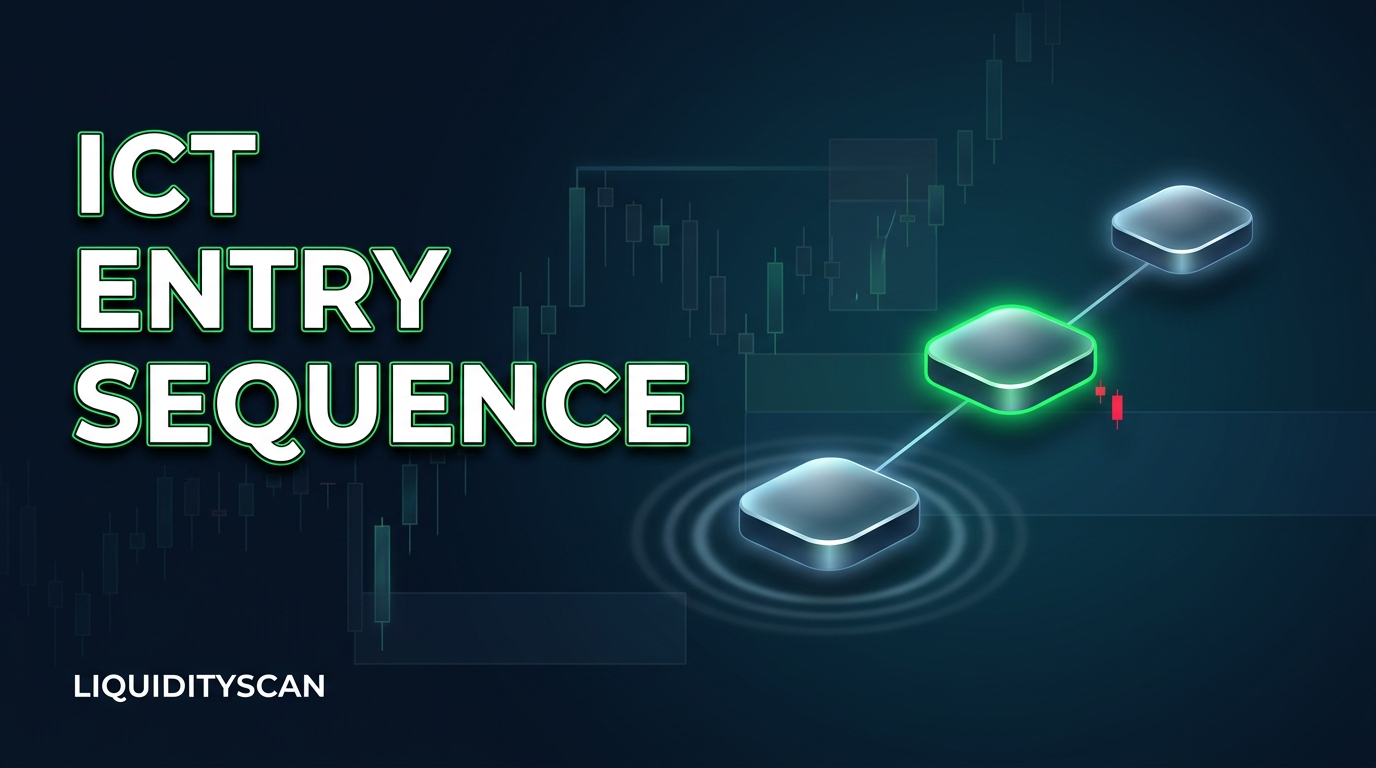
The ICT entry sequence is three events in a fixed order. First comes a liquidity sweep: price wicks past an obvious high or low to trigger the stops resting there, then closes back inside. Second comes a structure shift: a candle closes through the level that was holding the old direction. Third comes a retrace into the zone the shift left behind, which is where the entry is taken, with the stop beyond the sweep's extreme. Change the order or skip a step and it is a different trade.
The model comes from the concepts taught by ICT (Michael J. Huddleston). The pattern and why it forms are covered in the sweep-then-shift reversal sequence. This page deals with the practical problem: knowing which step a market is on right now, what has to print next, and when to stop watching it.
The three steps and what confirms each one
Every step is confirmed by a closed candle. A wick that is still moving proves nothing, and many bad entries in this model come from acting on a step that had not finished.
Step 1: the sweep
Picture a 1H chart that has drifted lower all morning and left two almost equal lows. Sell stops from longs sit just under them. ICT calls that sell-side liquidity (SSL), and the mirror above highs is buy-side liquidity (BSL). A candle drops through both lows and closes back above them. That close is the confirmation. Until it prints you cannot separate a sweep from a real breakout, because both look identical while the candle is open.
At this point, mark the low of the sweep wick. That price is the invalidation line for everything that follows. A sweep alone is not an entry.
Step 2: the structure shift
Now the question is whether buyers can close through something sellers were defending. There are two common yardsticks:
- CHoCH or MSS (change of character, market structure shift): a close above the most recent lower high.
- CISD (change in state of delivery): a close back above the level where the last run of down candles into the low began.
CISD tends to print first because its level sits closer to price. The trade-off is explained in CISD versus a market structure shift. Either way, look at how the level broke. Displacement, meaning a large-bodied candle that leaves a fair value gap (FVG, a three-candle gap where the first and third candles' wicks do not overlap), is stronger evidence than a close that clears the level by a tick.
Step 3: the retrace and the entry
The shift leaves a zone behind: the order block (the last down candle before the up move), the FVG inside the displacement, or the halfway point between the shift level and the sweep low. The entry in this model is the return to that zone, not the shift candle. The idea is invalid once a candle closes below the sweep low. It is also over, for practical purposes, if price runs to the next pool of liquidity without ever coming back. Chasing it at that point is a different trade with a much wider stop.
Stage tracker: where is this market in the sequence?
| Stage | Confirmed when | Wait for next | Dropped when |
|---|---|---|---|
| 1. Sweep | A candle trades beyond the swing level and closes back inside it | A close through the CISD level or the last opposing swing | Candles keep closing beyond the swept level |
| 2. Shift | A candle closes through the CISD level or the last lower high | A pullback toward the order block, FVG or halfway point | Price closes back past the sweep extreme |
| 3. Retrace | Price trades into the zone left by the shift | Your own entry trigger and risk plan | Price closes through the zone and the sweep extreme, or runs away without returning |
The table is written for a long setup after a sweep of lows. Flip every level for a short.
How to follow the sequence on LiquidityScan Confluence
LiquidityScan scans crypto, forex and TradFi markets for these events on closed candles and shows what it found. It is software, not a signal service: a detection is context for your own decision. The sequence tools live in Confluence. Pages inside the app need a free account.
1. Open the ordered playbooks
Confluence holds ready-made recipes of three kinds. Dual setups need two scanners on different timeframes to agree on the same market and direction, triple setups need three, and sequences are steps that must happen in a set order on the same market. A sequence signal appears when its last step completes. Each setup card shows the recipe from the biggest timeframe down, how many markets are live in it and which way they point.
Dual and triple setups belong to the Base plan and sequences to the Pro plan. Below those plans the cards stay browsable with their real timeframe ladder, order and live counts. The engine on each rung and the live signals open with the plan.
2. Pick the playbook that matches the part you trade
No single playbook is labelled sweep, shift, entry. The sequence is covered in halves:
- Sweep, then shift. A 1H liquidity sweep reclaimed by a same-direction CISD, both on the 1-hour chart. This is steps 1 and 2.
- Shift, then retrace. A 1H or 4H change of character flips structure, then price taps a strong order block (OB+ or OB++) in the new direction. A sister playbook starts from a 1H or 4H CISD instead of a CHoCH. These are steps 2 and 3.
- Continuation. A 1H or 4H break of structure (BOS, a close beyond the last swing in the trend's direction) confirms the trend, then the pullback taps a strong order block.
- Zone first. A strong order block or a Mega Order Block stack (order blocks nested inside a higher-timeframe block) forms within the last 12 bars, then a same-direction CRT sweep fires on that timeframe: 1H, 4H or daily. CRT is Candle Range Theory, a poke past a prior candle's range and a close back inside. Here the zone comes before the sweep.
On LiquidityScan an OB+ is an order block confirmed by a liquidity sweep, so the playbooks that end with an OB+ tap carry the sweep inside the zone's definition. What the grades mean is covered in how OB+, OB++ and FVG++ are graded. The top grades are part of Pro.
3. Watch the early steps on their own scanners
Because a sequence shows up only when its last step completes, the earlier steps are followed on the scanner pages.
- Step 1 is the Liquidity Sweep scanner: a stop-hunt wick beyond a level, then a reversal. Its entries note how many candles the reclaim took.
- Step 2 is the CISD scanner or the Market Structure scanner (BOS and CHoCH). A CISD marker clears early if price closes back past the swing, which is the same invalidation the sequence uses.
- Step 3 can be tracked from the CISD signal itself. It carries the MSS level and a FIB level, the halfway point between that level and the swing. On Starter and above you can arm a Fib-50 alert that pings at the halfway zone, or a retest alert for a return to the MSS level.
CISD is one of the eight classic scanners, free to read. Liquidity Sweep and Market Structure are premium: Free shows their live count, Starter opens them to browse, and alerts on them start on Base.
For a step that has not closed yet, the Waiting Room is the one place that looks at the forming candle. You name a market, an engine and a timeframe and it reports fired (the last close produced the signal) or armed (it would fire if the current candle closed now). How many waits you can run depends on the plan. The logic behind waiting for that close is in candle close confirmation.
4. Open the completed signal and check the order yourself
Inside a Confluence signal each scanner gets its own chart, marked on the candle where its signal formed. Use that to answer three questions before anything else: which candle was the sweep, where is its extreme relative to price now, and has price already left the zone? Signals expire once their trigger has played out, so an old one is history, not an opportunity.
From a signal you can open a War Room case for that market and follow it there. Alerts on Confluence setups run up to 10 a day, bundled with your other alerts, and arrive by browser push, Android push or the in-app bell. If the volume is still too high, narrow alerts by pattern, market and timeframe.
One limit to be clear about: these playbooks run on 1H, 4H and daily candles. Only the Fair Value Gaps and CISD+ scanners also have 5m and 15m, on Base and above, so refining the entry on a lower timeframe remains your own chart work. The Pro plan also includes the Structure Map, which pre-builds every BOS and CHoCH sequence. Those are described in the market structure playbooks.
Where the sequence fails
- Against the higher timeframe. A 1H sweep and shift inside a daily downtrend is often only a pullback. The retrace entry gets filled and then run. Checking whether 4H, daily and weekly agree before step 1 filters some of this, not all.
- A tap is not a reaction. A shift-then-retrace playbook completes when price reaches the zone. Whether the zone holds is unknown at that moment, and the ways order blocks fail apply in full.
- Closed candles cost time. On 4H you learn about the shift only at the close, and price can already be far from the zone. That is the price of not acting on wicks.
- Stale links. A sweep followed by a shift many candles later is a weak chain. The further apart the steps, the less the second one says about the first.
- No public outcome statistics. LiquidityScan does not publish outcome figures for these setups, so a completed sequence says the steps happened in order and nothing about what comes next.
Frequently Asked Questions
What is the correct order of the ICT entry sequence?
Liquidity sweep first, then a structure shift (CISD, CHoCH or MSS) confirmed by a candle close, then a retrace into the order block, FVG or halfway point left by the shift. The invalidation is the extreme of the sweep. A shift with no sweep before it is a plain structure break, and a sweep with no shift after it is just a wick.
Should the structure shift be a CISD or a CHoCH?
Both are used. CISD prints earlier and closer to the sweep, so it gives more room to the target and more false starts. A CHoCH needs a close beyond a swing point, so it is later and stricter. LiquidityScan has ordered playbooks built on each, which lets you compare them on the same market.
Can you enter on the shift candle instead of waiting for the retrace?
Some traders do. The trade-off is distance: the stop still belongs beyond the sweep extreme, so an entry at the close of the shift candle sits further from it and needs a smaller position for the same risk. Waiting for the retrace tightens that distance, but the retrace may never come.
Which timeframe should I track the sequence on?
The logic is the same on any timeframe. On LiquidityScan the ordered playbooks run on 1H, 4H and daily candles. Higher timeframes produce fewer sequences and each step takes longer to confirm, because it needs a closed candle.
Do I need a paid plan to follow the sequence on LiquidityScan?
On Free you can read the CISD scanner and see live counts for the premium scanners. Starter opens all 15 scanners to browse and adds Fib-50 and retest alerts. Base adds dual and triple Confluence setups with alerts, and Pro adds Confluence sequences and the Structure Map. Current prices are on the pricing page.
Does a completed sequence mean it is time to enter?
No. It means the steps happened in order on closed candles. LiquidityScan is not a signal service and never tells anyone to buy or sell. The entry trigger, the stop and the position size are your decisions.
Related reading
- Liquidity Sweep Then Structure Shift: The Stop-Hunt-to-Reversal Sequence — the pattern itself and why the sweep comes before the shift.
- Candle Close Confirmation: How to See ICT Setups One Close Before They Trigger — how to read a step that is armed but not yet closed.
- Market Structure Trading Strategy: Ready-Made Playbooks for Trends, Pullbacks and Reversals — the BOS and CHoCH sequences that sit next to the entry playbooks.