What a market structure shift is
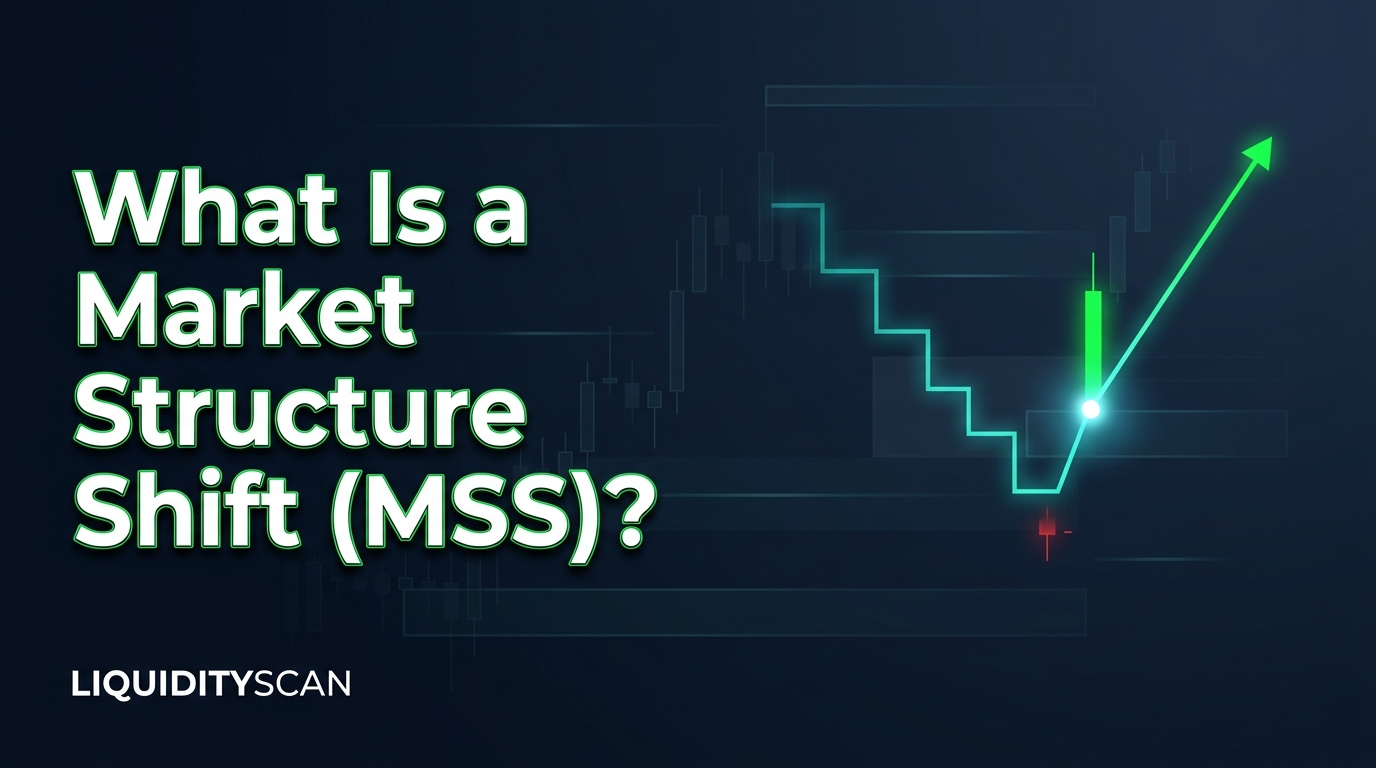
A market structure shift (MSS) is the moment a trend breaks its own pattern: price closes, with force, through the last swing point that stood against the move. In a downtrend that is a candle closing above the most recent lower high. In an uptrend it is a candle closing below the most recent higher low. In ICT teaching (the concept comes from Michael J. Huddleston, known as ICT) the break earns the name when two things surround it: a liquidity sweep just before, meaning price ran the stops resting beyond an obvious high or low, and displacement during the break, meaning one or more large-bodied candles that travel far and overlap little.
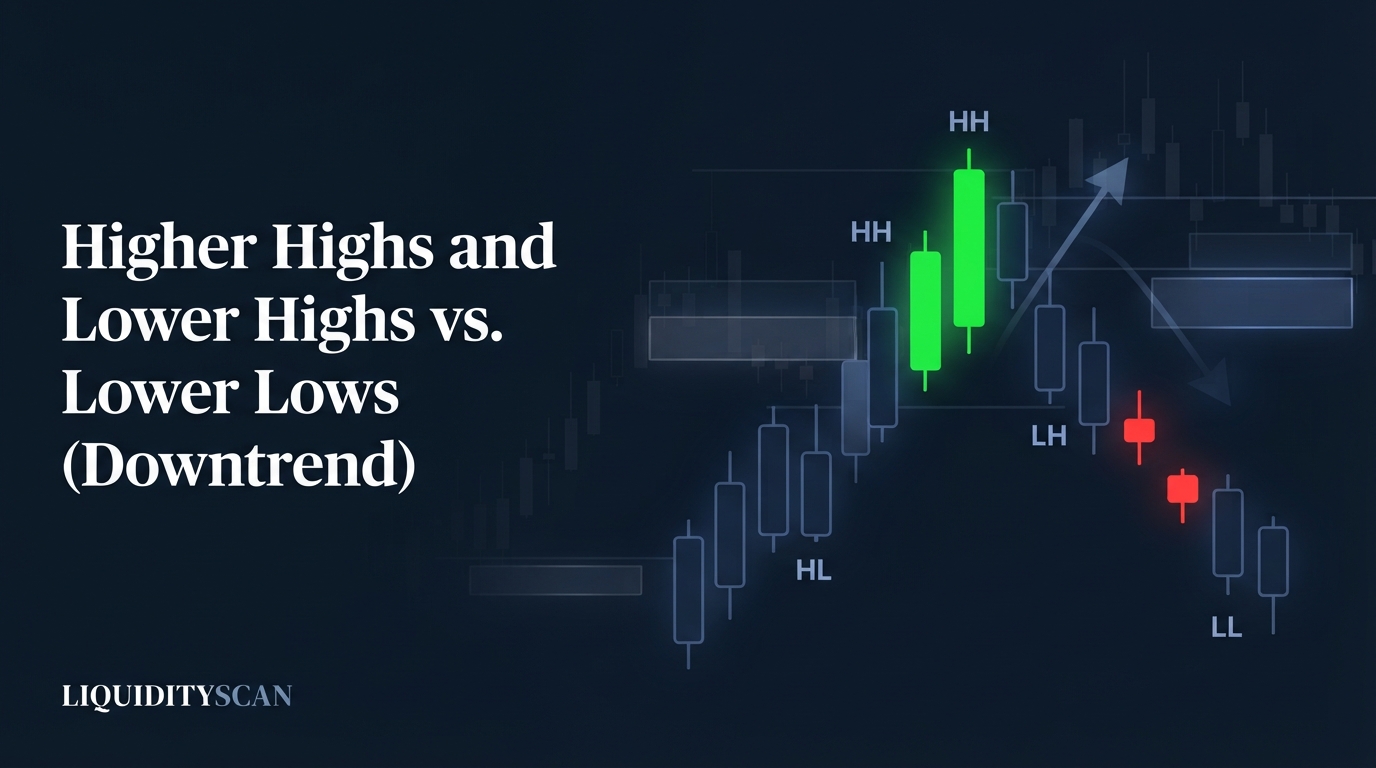
The logic is easy to picture. A downtrend is a chain of lower highs and lower lows, and each lower high marks the last place sellers pushed price back down. While those highs hold, sellers are still in charge. The first decisive close above one of them means the most recent sellers are now sitting in a losing position. That is not proof of a new uptrend. It is the earliest structural evidence that direction has changed, and it hands you a precise level at which the idea is wrong.
The rules for a valid MSS
The rules below describe a bullish shift. Flip every high and low for the bearish version.
- There is a trend to shift. You need at least two clear lower highs and lower lows on the timeframe you are reading. A swing high is a candle with a lower high on each side of it; the three-candle rule for swing highs and lows covers the edge cases. A sideways market has nothing to shift.
- Liquidity is taken first. Price trades below a low where stops are likely to sit (equal lows, the previous day's low, a session low) and fails to hold beneath it. This sweep is what separates a shift from a random bounce.
- You mark the correct swing. The level that matters is the lower high that formed immediately before the final low. Not a high from three legs back, and not a one-candle pause inside the last drop.
- A candle closes beyond it with displacement. The body has to close above the swing high. A wick through it does not count. The candles doing the work should be visibly larger than the ones before them. The usual footprint of displacement is a fair value gap (FVG), a three-candle pattern in which the first candle's high and the third candle's low do not overlap.
- The sweep low is the invalidation. If price trades back below the low that the sweep made, the shift has failed and the old trend is still in force.
What has to happen next: the break candle itself is rarely the entry. Traders who use the MSS wait for price to retrace into the FVG or into the order block (the last down-close candle before the displacement) that the move left behind. The sweep low is the line that proves them wrong, and the next pool of resting stops above is the target.
Two examples, candle by candle
Bullish MSS
Picture a 15-minute chart with invented prices. Price falls from 104.0, bounces to 102.6 and turns down again, so 102.6 is the most recent lower high. Below sit two equal lows at 100.8 left by the previous session.
- Candle 1 drops to 100.4, taking out the equal lows, then closes back up at 101.0 with a high of 101.2. That is the sweep.
- Candle 2 opens at 101.0 and closes at 102.4. It is the largest candle in the last twenty. Still no shift: price has not closed above 102.6.
- Candle 3 dips only to 102.0 and closes at 103.1. That close above 102.6 is the MSS.
Candle 1's high (101.2) and candle 3's low (102.0) do not overlap, so the zone between them is an FVG. A trader working this shift watches for a pullback into 101.2–102.0. The idea is invalid below 100.4. If candle 3 had only wicked to 102.9 and closed at 102.5, there would be no shift yet, only a strong bounce inside a downtrend.
Bearish MSS
Now a 1-hour chart in an uptrend. The latest higher low is 49.1 and equal highs sit at 50.3. One candle spikes to 50.6, closes back at 50.1 and has a low of 49.9: buy-side liquidity is taken. The next candle sells off to close at 49.4. The third candle reaches no higher than 49.5 and closes at 48.8, below the 49.1 higher low. That close is the bearish MSS. The gap between 49.5 and 49.9 is the FVG a retrace may revisit, and a trade back above 50.6 cancels the idea.
MSS vs BOS vs CHoCH vs CISD
All four labels describe price closing through a level, which is why they get mixed up.
| Term | What price breaks | Relative to the trend | What it tells you |
|---|---|---|---|
| BOS (break of structure) | The last swing in the trend's direction, such as the prior high in an uptrend | With it | The trend carried on |
| CHoCH (change of character) | The last swing against the trend, such as the latest higher low in an uptrend | Against it | A first warning; many sources do not require a sweep or displacement |
| MSS (market structure shift) | The same opposing swing, broken by a displacement close, usually after a liquidity sweep | Against it | Reversal evidence with a defined invalidation level |
| CISD (change in state of delivery) | The opening level of the last run of candles that drove into the swept high or low | Against it | An earlier, candle-based sign that often prints before the swing breaks |
The vocabulary is not standardised. CHoCH is the term used more in Smart Money Concepts material, and many traders use it and MSS for the same event. Others reserve MSS for the version with a sweep and displacement, which is the definition used here. The difference between a CHoCH and an MSS is worth settling in your own rulebook before you journal either one. CISD usually prints earlier than the swing break, and CISD vs MSS: which confirms a reversal first compares the two triggers side by side.
When an MSS fails, and what it does not tell you
- It was a minor swing. Structure nests across timeframes. A 5-minute shift inside a 4-hour downtrend is often nothing more than the 4-hour chart pulling back. An MSS carries weight on the timeframe where it formed and little above it.
- Nothing was swept. A break of a lower high in the middle of a range, with no stops taken first, is a weaker event. Nothing suggests the sellers have finished.
- There was no displacement. A slow grind that closes a fraction above the high tends to get sold straight back. A failure swing looks similar at first glance and is easy to confuse with a real break.
- The retrace never comes, or goes too far. Price can run without returning to the FVG, or it can return, slice through and take out the sweep low. The MSS gives a direction and an invalidation level. It says nothing about how far price will travel or whether you get filled.
- It is late by design. By the time a candle closes through the swing, part of the move is gone. That is the cost of waiting for confirmation.
- Swing selection is a judgement call. Two traders can mark different lower highs on the same chart. Fixed rules for what counts as a swing remove most of the disagreement, not all of it.
Time of day matters too. On currency pairs a shift printed in a quiet session deserves less weight than one printed as a major session opens, a point covered in spotting an MSS on major forex pairs.
How to find structure shifts on LiquidityScan
Marking swings by hand works on one chart. The slow part is repeating it across dozens of markets and timeframes. LiquidityScan's Market Structure scanner does that pass for you: it fires when a BOS or a CHoCH shifts the structure trend, in crypto, forex and TradFi markets alike. Pages inside the app need a free account, which you can create here.
- It reads closed candles only. A break appears after the candle that made it has closed, which matches rule 4 above.
- It speaks in BOS and CHoCH. The CHoCH side is the against-trend break this article calls a shift. Treat each detection as context, not an instruction: open the chart and check for the sweep and the displacement yourself.
- It is one of the seven premium scanners. The Free plan shows its live count but not the setups. Starter opens it to browse. Alerts on it belong to the Base plan and above.
- It does not cover 5m or 15m. Only the Fair Value Gaps and CISD+ scanners have those two timeframes, so the shifts you find here are higher-timeframe ones such as 1H and 4H.
Two related places are worth knowing. The CISD scanner, one of the eight classic scanners that are free to read, draws a level it labels MSS: the level where the last run of candles into the swing low or high began. It fires when a candle closes back beyond that level and shows the result as a chart marker with no entry, stop or targets. On the Pro plan, the Structure Map lists every BOS / CHoCH sequence pre-built and shows which markets just completed it, and Confluence sequences cover ordered steps such as a sweep followed by a shift in structure.
Frequently Asked Questions
Is an MSS the same as a CHoCH?
In practice, often yes. Both describe price breaking the last swing that stood against the trend. CHoCH is the name used more in Smart Money Concepts material. Many ICT traders say MSS and add two requirements: liquidity is swept first and the break is a displacement close. Pick one definition and apply it the same way every time.
What is the difference between an MSS and a BOS?
A BOS breaks a swing in the direction of the existing trend, so it signals continuation. An MSS breaks a swing against the trend, so it signals a possible reversal. After a bullish MSS, the first BOS to the upside is what shows the new direction followed through.
Does the candle have to close beyond the level, or is a wick enough?
It has to close beyond it. A wick through the swing shows price reached the level and was pushed back, which is closer to a sweep than to a shift. Wait for the candle to finish before calling it.
What timeframe is best for spotting an MSS?
There is no single best one. A common approach is to read direction on a higher timeframe such as the daily or 4-hour, wait for price to reach a level of interest there, then look for the shift on a lower timeframe such as 15 or 5 minutes. A shift that agrees with the higher timeframe has more context behind it than one that fights it.
Where is an MSS invalidated?
At the extreme of the sweep that came before it: the sweep low for a bullish shift, the sweep high for a bearish one. If price trades back through that point, the reason for the idea is gone.
Related reading
- MSS vs BOS: The Difference Between a Structure Shift and a Break of Structure — the two breaks compared on the same leg, so you stop labelling continuations as reversals.
- Liquidity Sweep Then Structure Shift: The Stop-Hunt-to-Reversal Sequence — a closer look at rule 2 and why the order of events matters.
- ICT Entry Sequence: How to Follow Sweep, Structure Shift and Entry as the Setup Forms — what to watch between the shift and the retrace entry.
- How to Detect BOS and CHoCH Automatically Across Every Pair — more on scanning structure breaks instead of marking them by hand.