The short answer: same candle, different market around it
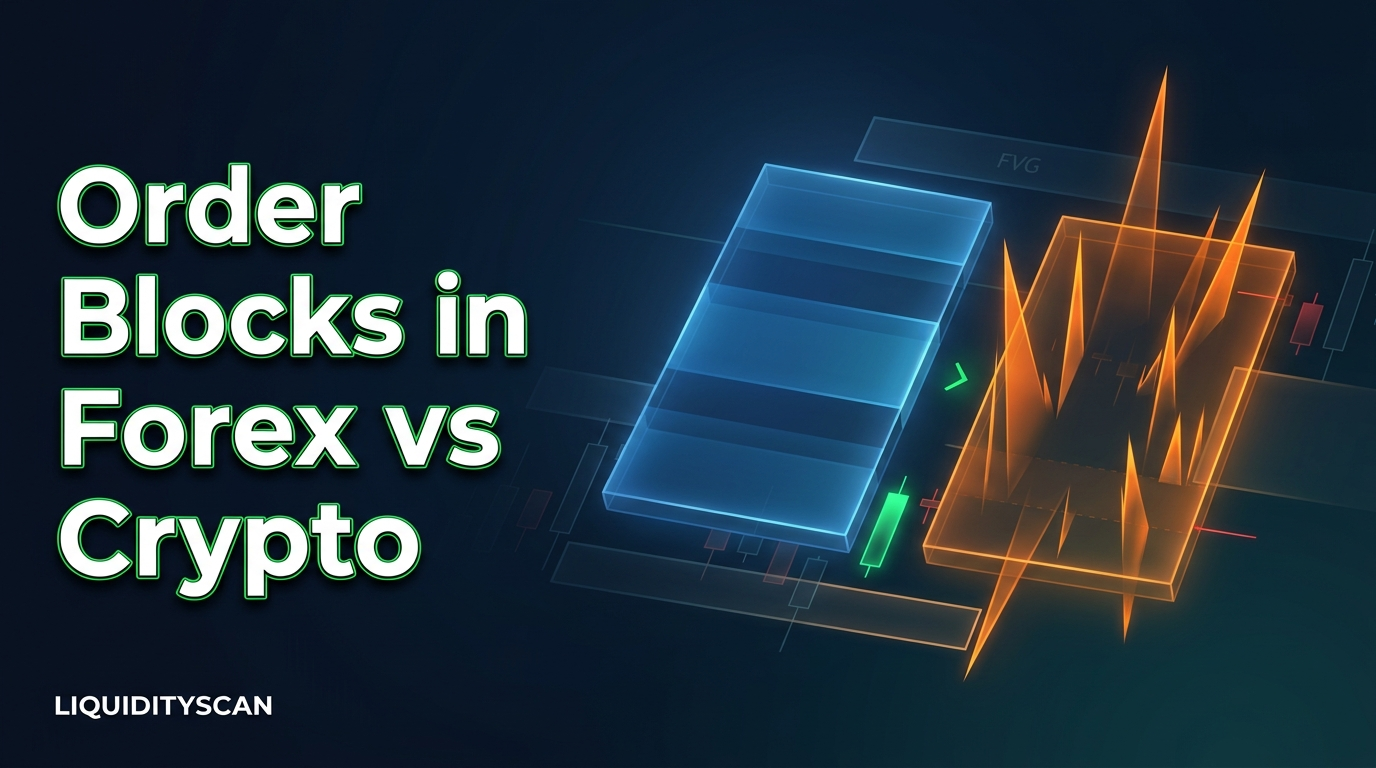
An order block is defined the same way in forex and in crypto: it is the last opposing candle before a displacement (a run of large, one-directional candles) that breaks structure. What differs is the market around that candle. Forex trades in sessions five days a week, can gap over a zone at the weekly open and has no central price feed or volume. Crypto trades every hour of every day, has no weekend gap, and its leveraged perpetual contracts (futures with no expiry) throw long liquidation wicks through zones. Those differences decide where you draw the block, where the stop sits and what counts as invalidation.
If the definition is still new, read what an order block is and how it forms first. The rest assumes you can mark one and want to know why the same rules feel different on a major pair and on a Bitcoin or altcoin perpetual.
What does not change
The price logic is identical. A bullish order block is the last down-close candle before price displaces upward and closes above a prior swing high, which is a break of structure (BOS). A bearish one is the mirror: the last up-close candle before a displacement down through a swing low. In both markets, traders give more weight to a block that has three things:
- A liquidity sweep first. Price wicks beyond an obvious high or low where stops rest, then closes back, before the displacement starts.
- A fair value gap (FVG) left behind. Across three candles of the displacement, the first candle's wick and the third candle's wick do not overlap, which shows price left in a hurry.
- No return yet. The first time price comes back to the block, called mitigation, is the visit traders watch.
Invalidation is the same idea everywhere: a candle that closes through the far side of the block says the orders behind it did not defend it. The two markets part ways in how often a wick, a gap or a spread makes that simple rule hard to apply.
Order blocks in forex vs crypto at a glance
| Factor | Forex | Crypto perpetuals |
|---|---|---|
| Trading hours | Sunday evening to Friday evening New York time, split into Asia, London and New York sessions | Continuous, weekends included |
| Weekend gap | Possible at the weekly open; price can open beyond a block | None; candles are continuous |
| Daily candle close | Commonly 5 pm New York, depending on the broker | Midnight UTC on most exchanges |
| Price feed | Decentralised; wicks differ slightly between brokers | Per exchange; spot and perpetual prices can differ |
| Volume data | Tick volume only on spot | Traded volume and open interest |
| Retest hazard | Spread widening around rollover and news | Liquidation wicks through the zone |
| Correlation driver | Shared currencies, most often the dollar | Bitcoin |
| Scheduled catalysts | Economic releases and central bank decisions | Fewer fixed events; macro releases and leverage flushes |
The session clock: when the block was built
In forex, the hour a block formed tells you a lot about who built it. The day runs through Asia, London and New York, and participation concentrates in the kill zones, the windows around the London and New York opens when the most orders meet. A familiar sequence on a major pair: Asia builds a narrow range, London wicks through one side of it, and the displacement that follows leaves an order block at the turn. That block was built when the market was deep. A block printed late in the New York afternoon was built by far less business, and the next London open can run straight through it. Knowing the forex kill zone times and what to expect in each comes before grading any forex block.
Crypto has no closing bell, so an order block can print at any hour, including Saturday night. That does not make all hours equal. A block formed in a thin weekend market may be one large order moving an empty book, and when weekday participation returns it is tested by much heavier flow. Whether the classic windows carry over at all is covered in whether kill zones apply to a market that never closes. The habit worth copying from forex is simple: write the session next to the zone. Crypto traders tend to skip that step because the chart never pauses.
Gaps and candle boundaries
Forex closes on Friday and reopens on Sunday. If news lands in between, the first price of the week can sit above or below a block you marked on Friday. A zone that price jumped over was never traded through, so it was neither mitigated nor cleanly invalidated. Treat it as stale until price shows how it behaves on the way back. The mechanics of the Sunday open and the weekend gap matter most to swing traders who hold 4H and daily blocks over the weekend.
Crypto perpetuals do not close, so a block cannot be gapped over between sessions. The trap there is the candle boundary. Most crypto exchanges close the daily candle at midnight UTC. Forex brokers commonly close it at 5 pm New York, and some add a short Sunday candle. An order block is one specific candle, so the daily or 4H block you get depends on where the platform cuts the candles. Two forex traders at different brokers can mark slightly different zones on the same pair and neither is wrong. On lower timeframes the effect fades; on the daily it can shift the zone noticeably.
Wicks, liquidations and spread: how the retest behaves
This is the difference traders feel most. Crypto perpetuals carry leverage, and when price moves against a crowded side, forced liquidations sell into a falling market or buy into a rising one. The result is a long wick that stabs through a block's low and snaps back inside the same candle. If your rule is that a wick beyond the block invalidates it, crypto will take you out of zones that then hold. If only a close beyond it counts, the stop has to sit far enough away to survive the wick, which means a smaller position for the same risk.
Two adjustments are common on crypto charts. Some traders draw the block from the full candle range, wick included, to give the zone room. Others keep the body as the zone and place the stop beyond the swing the sweep created, not just beyond the block. Neither is correct by definition. The marking rule and the stop rule have to match.
Forex has a quieter version of the same problem. Charts normally plot the bid price, while a short position is closed at the ask, which is the bid plus the spread. Around the daily rollover and around major releases the spread widens, so a stop placed just above a bearish order block can be triggered while the chart shows price never reached it. On majors in liquid hours the spread is small against a 1H block; on crosses and exotics it can be a real slice of the zone. More on this in how stop hunts differ between forex and crypto.
What you can confirm with: volume and correlation
Spot forex has no central exchange, so there is no true traded volume. What a forex chart calls volume is tick volume, a count of price changes at your broker, and it is only a rough gauge of activity. Crypto exchanges publish traded volume and open interest, so you can see whether the displacement away from a block came with real participation. That is an advantage with a caveat: volume shows activity, not resting orders, a distinction explained in why liquidity and volume are not the same thing.
Correlation works differently too. Forex pairs share currencies. When the dollar moves, bullish blocks appear on several dollar pairs at once, and they are one idea expressed several times. Taking all of them multiplies the size of a single view. In crypto the anchor is Bitcoin. An altcoin can print a clean bullish block, and if Bitcoin then breaks its own structure lower, that block is likely to be tested hard however good it looked. The check is the same in both: look at the driver before trusting the zone.
The same setup marked in both markets
Picture a 1H chart of a major forex pair. Asia holds a tight range overnight. In the London kill zone a candle wicks below the Asian low and closes back inside. The next candle is a small down-close candle, and the two after it are large up-close candles that close above the prior 1H swing high and leave an FVG. The small down-close candle is the bullish order block. The zone is its range, the entry idea is a return to it, often to its midpoint (the mean threshold), and the idea is invalid if a 1H candle closes below its low. The practical risks are a New York release that drives straight through it, and the spread if the stop is tight.
Now the same structure on a 1H altcoin perpetual on a Saturday. The marking is identical. The questions are different. Did the displacement come with volume, or was it one order in a thin book? Where is Bitcoin in its own range? When price returns, will a liquidation wick pierce the block's low before any close decides it? A stop distance borrowed from the forex chart can sit inside that wick. The usual answer is a wider stop and a smaller position, and a position size calculator for crypto and forex turns the stop distance into a size so the money at risk stays the same in both markets.
In either market the block can simply fail. A zone against the higher-timeframe direction, a zone already mitigated once, or a zone with no sweep behind it fails for the same reasons everywhere, listed in the invalidation rules most traders miss.
What traders get wrong about the comparison
- Treating the asset class as the variable. The liquidity of the instrument matters more than its label. A thin exotic pair and a small-cap perpetual have more in common with each other than either has with a major pair or with Bitcoin: wide spreads, gappy candles, zones that get run over.
- Copying stop distances across markets. A stop that fits a major's 1H block is measured against that pair's normal range. On a volatile altcoin it sits inside ordinary noise.
- Reading the zone as a prediction. An order block marks where price may react. It does not say whether it will, how far the reaction runs, or whether the higher timeframe agrees.
Finding sweep-confirmed order blocks in both markets on LiquidityScan
LiquidityScan's Order Blocks (OB+) scanner looks for one specific version of the pattern: a strong order block confirmed by a liquidity sweep. Detection runs on closed candles only, so a block is never reported from a candle that is still forming. Pages inside the app need a free account, which you can create here.
The scanner runs in every market mode, so you can check the comparison in this article for yourself:
- Forex mode covers 72 instruments: 7 majors, 21 crosses, 39 exotics and 5 metals. Exotics sit on a separate tab and stay out of alerts unless you pick them, because their spreads are wide and their prices gappy. In one recently verified week, forex alone produced 242 OB+ zones. Open the forex Order Blocks page.
- Crypto mode scans perpetual contracts. Open the crypto Order Blocks page.
- TradFi mode covers stocks, indices and commodities as perpetual contracts, plus 11 index CFDs.
Each detection carries a grade, OB+ or OB++, and a separate guide explains what OB+, OB++ and FVG++ mean. Order Blocks is one of the seven premium scanners. On the Free plan you see its live count, not the setups. Starter opens the scanner to browse. Alerts on it belong to the Base plan and above, delivered by browser push, Android push and the in-app bell, and the top OB++ grade belongs to Pro. The platform's 5m and 15m timeframes exist only for the Fair Value Gaps and CISD+ scanners, so this is not a scalping feed for order blocks.
A detection is context, not an instruction. LiquidityScan is software and education, not a signal service. The session, the spread, the driver and the stop are still yours to check, and those are the checks that differ between a forex pair and a perpetual.
Frequently Asked Questions
Is an order block defined differently in forex and crypto?
No. In both it is the last opposing candle before a displacement that breaks structure, and it is invalid when a candle closes through its far side. The differences are in the surroundings: trading hours, gaps, candle boundaries, wick depth, spread and the data available to confirm the move.
Should I mark crypto order blocks with wicks or bodies?
Either can be consistent. The full range gives the zone room for the deep wicks that liquidations cause. The body gives a tighter zone and needs a stop placed further away, usually beyond the swept swing. Pick one rule and make the stop rule match it.
Are order blocks that form on a crypto weekend worth marking?
They can be marked, with a note on when they formed. Weekend participation is thinner, so a displacement may reflect very little business. Many traders wait to see how such a zone holds once weekday flow returns before giving it the weight of a weekday block.
Why was my stop hit when price never reached my forex order block?
Most forex charts plot the bid, while a short position is closed at the ask, which is the bid plus the spread. When the spread widens around rollover or a release, the ask can touch a stop that the chart never shows being reached.
Can I scan order blocks on both forex and crypto in one place?
Yes. LiquidityScan's Order Blocks (OB+) scanner runs in the Crypto, Forex and TradFi modes and reports only on closed candles. On the Free plan it shows a live count. Browsing the setups starts on Starter and alerts on Base.
Related reading
- How to Find Strong Order Blocks That Took Liquidity (OB+ and OB++) — why a sweep before the block matters and how to look for it.
- Best ICT Model for Crypto and for Forex: Which Setups Carry Over and Which Don't — the same comparison applied to whole entry models, not just zones.
- Best Forex Pairs for ICT Traders: Majors, Crosses and Why Exotics Behave Differently — which pairs give order blocks cleaner conditions and which add spread and gap risk.